Research Techniques
CARDIOVASCULAR

Cardiac Nuclear Magnetic Resonance
Analysis of Blood Pressure and Cardiac Function in Experimental Models

Electrocardiogram
Study of electrical alterations in animal models

Cardiomyocyte Isolation
In-vivo analysis of cardiomyocytes function

Excitation-contraction (EC)-coupling
Study of Calcium Handling by confocal microscopy

Experimental animal model
Post-Myocardial Infarction (PMI)

Histo - Imunnofluorescence Techniques
Study of tissue and cellular structure
In-vitro cellular culture
HL-1, AC16
RENAL
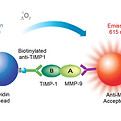
Protein Interactions by AlphaLISA Technology
MMP-9-TIMP-1

Calculation of Oxidative Status
Oxy-SCOREs and AntiOxy-SCOREs

Gelatinase MMP Activities
MMP-2 and MMP-9

Experimental Animal Models
Model of Chronic kidney disease (Nephrectomy 5/6), renal isquemia-reperfusion, and model of acute kidney failure

Biomarkers of Mineral Metabolism, Vascular Remodeling, Oxidative Stress, Inflammation...
Phosphates, Creatinine, FGF23, Klotho, ...

Proteomics
Describe the item and include any relevant details. Click to edit the text.
IMMUNE SYSTEM

PBMCs isolation by density gradient
Using Ficoll/Percoll gradients, cells are separated by cell density

Tissue immunofluorescence for immune infiltration
We visualize immune cell infiltration in the heart and kidneys

In vivo perfusion of laboratory animals
Doing this, blood‑free and/or uniformly (fixed) tissues are obtained

THP-1 monocyte migration assay
This assay measures chemotaxis of THP‑1 cells across a porous membrane toward a chemoattractant

Multiparametric flow cytometry for immune phenotyping
Fluorescent antibodies quantify multiple markers per cell to define immune subsets

Macrophage/neutrophil migration with sera/plasma
For testing sera/plasma‑driven macrophage/neutrophil migration

NLRP3 inflammasome activity in macrophages
We determine inflammasome activation level by evaluating ASC specks formation
Small particle analysis in plasma by flow cytometry
High‑sensitivity flow cytometry detects microparticles based on scatter and markers
CORE TECHNIQUES


ELISA
Quantificaction of cardiac/renal injury markers, mineral metabolism-related factors and inflammatory mediators
qRT-PCR
Quantification of cardiac, renal, and inflammation/immune system-related genes
Western Blot
Detection of specific proteins, including post-translationally modified proteins such as phosphorylated or oxidized forms

Blood Urea Nitrogen determination
Determination of BUN as an indicator of renal function

Apoptosis determination
Determination of cell death in heart/kidneys using the TUNEL assay
Zymography
Detection of enzymatic activity, including MMP-9 and MMP-2 gelatinase activity

Proteomics
Profile protein expression and signaling

Single nuclei RNAseq (snRNA-seq)
Map gene expression at single‑nucleus resolution